BDSN network Power Spectral Density plot
Noise Analysis
Network PDF Summary
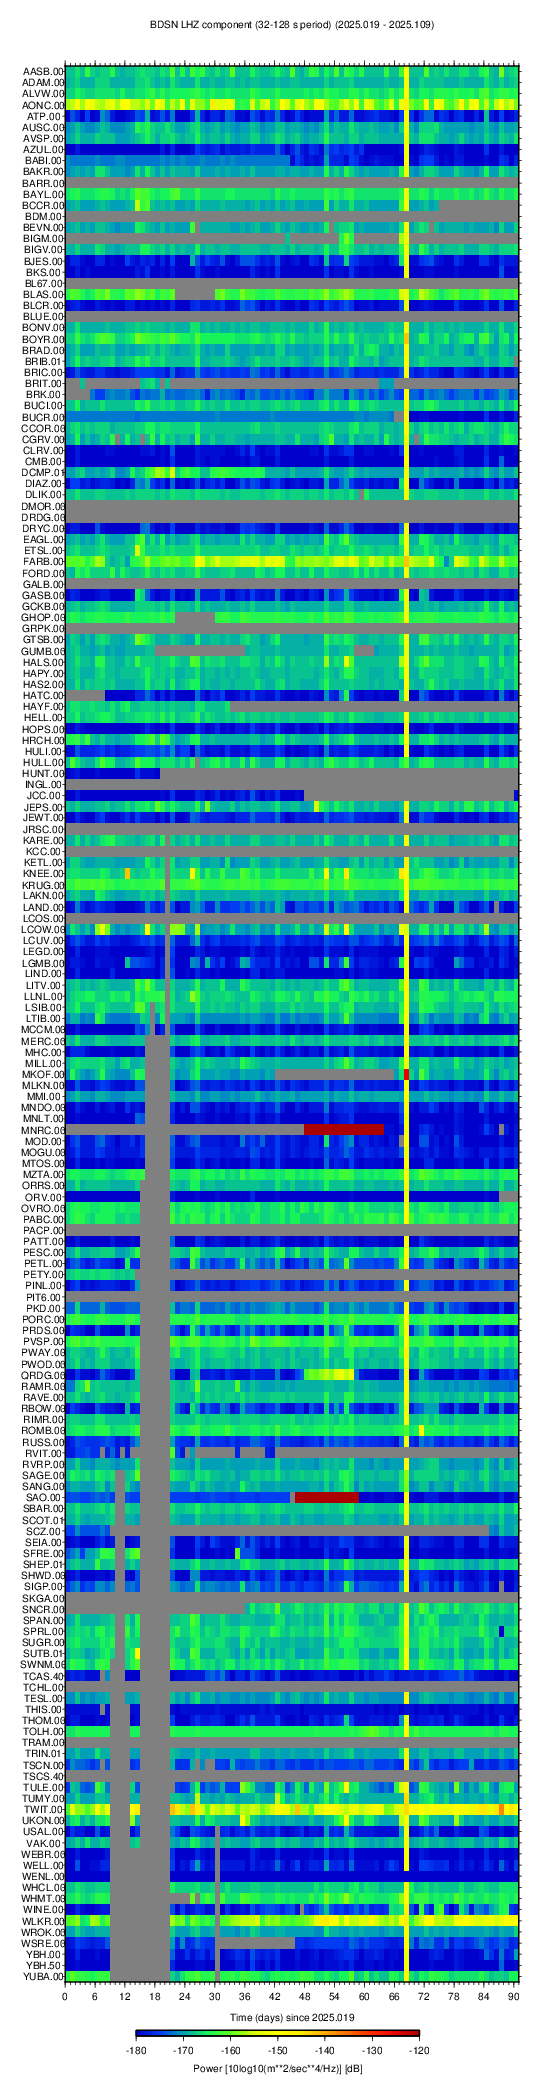
Changes in the seismic noise recorded at a site in the absence of earthquakes may be an indication of instrumental or other problems. Thus, the regular review of the noise is a useful tool for evaluating station performance and quality. The table below provides access to summary plots of the minimum power measured at each station in a particular frequency band over a specific time period. The plots help assess possible changes in the long-term noise characteristics of the sites we and our collaborators operate. The sample plot to the right of the table summarizes the noise from the PDF analysis (see below) for the LHZ components of the stations of the BDSN network.
| Network | Frequency range | |
|---|---|---|
| Short period | Long period | |
| BDSN | 0.5-1.0 s | 32-128 s |
| BDSN SM | 0.125-1.0 s | 32-128 s |
| HRSN | 0.125-0.5 s | 32-128 s |
| BBN (NHFN &mPBO) | 0.125-0.5 s | 32-128 s |
| BBN (NHFN &mPBO) SM | 0.5-1.0 s | 32-128 s |
| NCSN EH | 0.125-0.5 s | N/A |
| NCSN BB | 0.5-1.0 s | 32-128 s |
| NCSN SM | 0.125-1.0 s | N/A |
| NSMP BB | 0.5-1.0 s | 32-128 s |
| NSMP SM | 0.125-1.0 s | N/A |
| CI | 0.5-1.0 s | 32-128 s |
Station PDF Detail
- Current week and year for each station
- Current week and year for each channel type
- Weekly history for each channel for these networks: BK BG BP CE CI NC NN NP PB PG SF WR
- Archived PSD plots: 2005 2006 2007 2008 2009 2010 2011 2012 2013 2014 2015 2016 2017 2018 2019 2020 2021 2022 2023 2024
The above links will lead you, after one or more clicks, to pages presenting collections of Power Spectral Density plots. On these collection pages, you can click on any of the plots to bring up a blow-up view of the individual plot. The blow-up view includes links to the other collections available for that particular channel.
On the single-plot page, you can click on the plot to bring up information about that region of the plot. The main part of this information page is a list of time spans of the channel data during which the plot feature was produced. For people with access to BSL computers, You can cut and paste an entry from this time span list into the qdata command line to extract data for that period.
The PSD plots presented here are produced using programs developed by Dan McNamara and Ray Buland (BSSA 94:4 2004) at USGS, Golden. We have extended that code to allow processing of most of the real-time data collected by the NCEDC: broadband, strong motion and bore-hole seismic data, strain and electro-magnetic data. You will also want to see the PSD plots for other stations and networks at the IRIS DMC using their MUSTANG system.